F2 in Node.js

Although F2 is based on Html5 Canvas, but for the current runtime environment, as long as it provides the same context interface as HTML5 Canvas does, F2 can still be able to run correctly.

The following table shows the functions that can be used under different runtime environment:

HTML5

Node

Chart Drawing

✔︎

✔︎

Legend

✔︎

✔︎

Tooltip

✔︎

Event (Tooltip, Legend interaction)

✔︎

Animation

✔︎

Rendering in Node

Running F2 on the node can provides a powerful server-side ability to render visualization charts. In this way, F2 can be used to generate offline reports, pdf and other visualization charts.

F2 currently supports all chart drawing functions in node runtime environment, but it does not provides events, interactions and animation capabilities (Please remove the code associated with chart.tooltip() and chart.animate() when try with the demos). Now let us start!

STEP 1: install node-canvas

npm install canvas

STEP 2: import F2

What needs to be explained here is that node does not support animation, events and Tooltip. Therefore, please try to avoid using above modules when using F2. This can also make a better package size. For convenience, it is recommended to require as follows:

const F2 = require('@antv/f2/lib/core'); 

require('@antv/f2/lib/geom/');
require('@antv/f2/lib/geom/adjust/');

require('@antv/f2/lib/coord/polar');
require('@antv/f2/lib/component/axis/circle');

require('@antv/f2/lib/scale/time-cat'); 

require('@antv/f2/lib/component/guide');
const Guide =  require('@antv/f2/lib/plugin/guide');
const Legend =  require('@antv/f2/lib/plugin/legend');
F2.Chart.plugins.register([ Legend, Guide ]);

STEP 3: Create a canvas

const Canvas = require('canvas');
const canvas = Canvas.createCanvas(400, 267);

STEP 4: Draw a chart using F2

Followings are two ways to create a chart, and note that width and height properties must be set in both ways.

// First way to create a chart, pass canvas directly
const chart = new F2.Chart({
  el: canvas, // pass the canvas object created in step 3
  width: 400, // must be set, width of the chart, same as the canvas
  height: 267 // must be set, height of the chart, same as the canvas
});

// Second way to create a chart, pass the canvas context
const chart = new F2.Chart({
  context: canvas.getContext('2d'), // pass the canvas context created in step 3
  width: 400, // must be set, width of the chart, same as the canvas
  height: 267 // must be set, height of the chart, same as the canvas
});

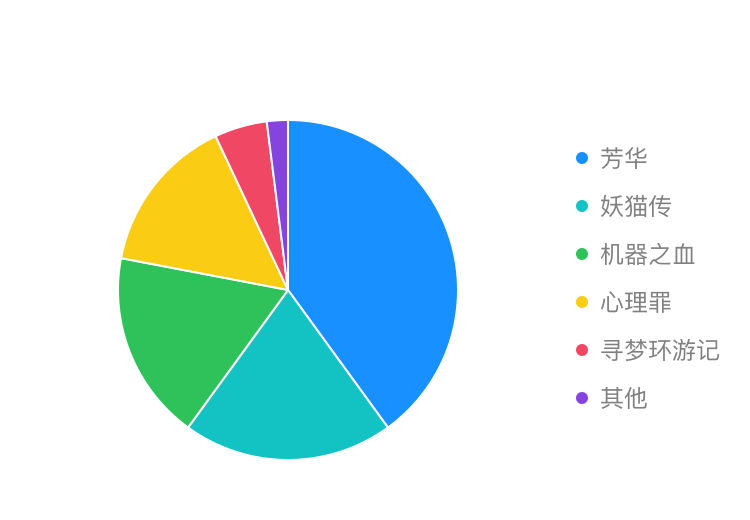
Following is a complete example for drawing a pie chart:

const fs = require('fs');
const path = require('path');

const Canvas = require('canvas');
const F2 = require('@antv/f2/lib/core');
require('@antv/f2/lib/geom/');
require('@antv/f2/lib/geom/adjust/'); 
require('@antv/f2/lib/coord/polar'); 
require('@antv/f2/lib/component/axis/circle'); 
require('@antv/f2/lib/scale/time-cat');
require('@antv/f2/lib/component/guide');
const Guide = require('@antv/f2/lib/plugin/guide');
const Legend = require('@antv/f2/lib/plugin/legend');
F2.Chart.plugins.register([ Legend, Guide ]);

// create a canvas
const canvas = Canvas.createCanvas(375, 260);

// draw pie chart
function drawPie() {
  const data = [
    { name: '芳华', percent: 0.4, a: '1' },
    { name: '妖猫传', percent: 0.2, a: '1' },
    { name: '机器之血', percent: 0.18, a: '1' },
    { name: '心理罪', percent: 0.15, a: '1' },
    { name: '寻梦环游记', percent: 0.05, a: '1' },
    { name: '其他', percent: 0.02, a: '1' }
  ];
  const chart = new F2.Chart({
    el: canvas,
    width: 375,
    height: 260,
    padding: [ 45, 'auto', 'auto' ]
  });
  chart.source(data, {
    percent: {
      formatter(val) {
        return val * 100 + '%';
      }
    }
  });
  chart.legend({
    position: 'right'
  });
  chart.coord('polar', {
    transposed: true,
    radius: 0.85
  });
  chart.axis(false);
  chart.interval()
    .position('a*percent')
    .color('name', [ '#1890FF', '#13C2C2', '#2FC25B', '#FACC14', '#F04864', '#8543E0' ])
    .adjust('stack')
    .style({
      lineWidth: 1,
      stroke: '#fff',
      lineJoin: 'round',
      lineCap: 'round'
    });

  chart.render();

}

drawPie();

// export and store the image
canvas.createPNGStream().pipe(fs.createWriteStream(path.join(__dirname, 'pie.png')));

Solution for device resolution

The solution for resolution is simple: Assume that the pixel ratio of the current device is 2, then just set the pixelRation property when creating an F2 chart.

const chart = new F2.Chart({
  el: canvas,
  width: 375,
  height: 260,
  padding: [ 45, 'auto', 'auto' ],
  pixelRatio: 2
});

Here we set the width and height of the canvas to 375 * 360. After setting the pixelRatio to 2, the width and height of the canvas will be magnified by 2 times accordingly, therefore the chart's size will be 750*520. This way, you can ensure the clear display of the chart, as shown below:

  • pixel ratio: 2

  • chart's actual size: 750 * 520

  • chart's style (display size): style="width: 375px;height: 260px;"

Last updated