# Shape
## `F2.Shape`
F2.Shape provide an ability to customize shapes. With this, we can create a lot of interesting charts.
### **How to register**
```javascript
const Shape = F2.Shape;
const shapeObj = Shape.registerShape('geomType', 'shapeName', {
getPoints(pointInfo) {
// get the key points for drawing the shape
},
draw(cfg, container) {
// custom the final drawing routine
return shape; // return the customed shape instance
}
});
```
The explanation of the main methods are described below:
#### `getPoints(pointInfo)`
`getPoints` is used to calculate the key points of each shape. Each shape in F2 is connected by a number of key points.
**Parameters:**
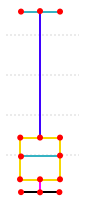
* `pointInfo`: Object
The values of the pointInfo are all normalized (range from 0 to 1), and the structure of the `pointInfo` is shown below:
```javascript
{
size: 0.1, // size of the shape, different shapes have different meanings
x: 0.2, // the x-axis coordinate after normalization
y: 0.13, // the y-axis coordinate after normalization
y0: 0.1 // minimum value of the data corresponding to the y-axis after normalization.
}
```
The following table lists the key point information mechanisms for each geometry shape in F2:
| geom type | Explanation |
| --------- | ------------------------------------------------------------------------------------------------------------------------------------------------------------------------------------------------------------------------------------------------------------------------------------------------------------------------------------------------------------------------------------------------------------------------------------------------------------------------------------------------------------------------------------------------------------------------------------------- |
| point | Drawing a point is very simple, just get its position and size, where the size attribute represents the radius of the point.
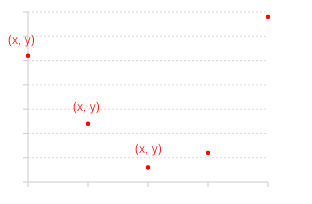
|
| line | The line is actually make up of plenty of points. In F2, we convert the data involved in the drawing into points and then connect the points one by one through the line to form a line chart. The size attribute represents the thickness of the line.
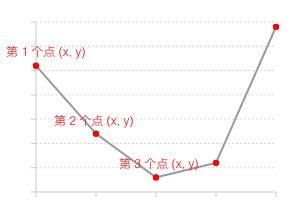
|
| area | The area is formed on the basis of the line. Area uses color or texture to fill the area between the polyline and the x axis.
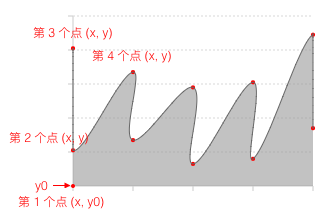
|
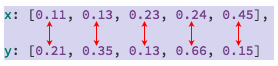
| interval | The default shape for the interval is a rectangle, and the rectangle is actually composed of four points. In F2 we calculate the four points from the x, y, size, and y0 in the pointInfo, and then connect them clock wisely to form a rectangle.
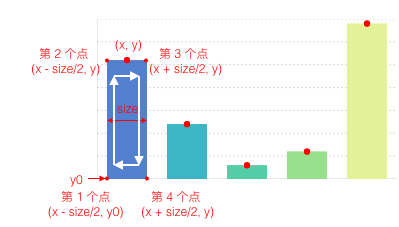
|
| polygon | Polygons are actually connected by multiple points. In pointInfo, both x and y are arrays.
|
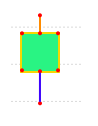
| schema | Schema is a custom shape type. F2 provides a customized shape called candle (i.e. stock chart or k-line chart) to draw stock chart. The connection order of the rectangle is clockwise, and the starting point is the bottom left point so that you can seamlessly switch to polar coordinate.
|
#### `draw(cfg, container)`
`getPoints` used to calculate the key points of each shape, so the `draw` method is used to define how the points are connected and construct a shape.
NOTE: the `draw` method must return the shape instance.
**Parameters**
* `cfg`: Object
This parameter contains all the data after mapping and corresponding raw data. The structure of the parameter is shown below:

1\. The original data is store in `cfg.origin._origin`
2\. The key points that calculated by `getPoints` is stored in `points`
3\. `color`, `size` and `shape` in `cfg` are all graph attributes after mapping and can be used directly.
* `container`: F2.G.Group instance, the container for shapes.
It is a container. The customized shape must first be added to the container.
**In addition, we provide some utility methods to help users quickly convert normalized data to canvas coordinates**. You can call these methods in the above two methods:
```javascript
Shape.registerShape('interval', 'rect', {
getPoints(pointInfo) {
// ...
},
draw(cfg, container) {
// ...
path = this.parsePath(path);
// ...
//
return shape;
}
});
```
#### `parsePoint(point)`
Convert the point in the range of \[0, 1] to the actual coordinate on the canvas.
**Parameters:**
* `point`: Object
The structure of the point is shown below:
```javascript
{
x: 0.3,
y: 0.34
}
```
#### `parsePoints(points)`
Convert the points in the range of \[0, 1] to the actual coordinates on the canvas.
The structure of points:
```javascript
[
{ x: 0.3, y: 0.34 },
{ x: 0.3, y: 0.34 }
]
```
### Code Demo

```javascript
const Shape = F2.Shape;
Shape.registerShape('interval', 'triangle', {
getPoints: function(cfg) {
const x = cfg.x;
const y = cfg.y;
const y0 = cfg.y0;
const width = cfg.size;
return [
{ x: x - width / 2, y: y0 },
{ x: x, y: y },
{ x: x + width / 2, y: y0 }
]
},
draw: function(cfg, group) {
const points = this.parsePoints(cfg.points); // 将0-1空间的坐标转换为画布坐标
const polygon = group.addShape('polygon', {
attrs: {
points: [
{ x:points[0].x, y:points[0].y },
{ x:points[1].x, y:points[1].y },
{ x:points[2].x, y:points[2].y }
],
fill: cfg.color
}
});
return polygon; // 将自定义Shape返回
}
});
const data = [
{ genre: 'Sports', sold: 275 },
{ genre: 'Strategy', sold: 115 },
{ genre: 'Action', sold: 120 },
{ genre: 'Shooter', sold: 350 },
{ genre: 'Other', sold: 150 }
];
const chart = new F2.Chart({
id: 'mountNode',
width: 500,
height: 320,
pixelRatio: window.devicePixelRatio
});
chart.source(data);
chart.interval().position('genre*sold').color('genre').shape('triangle');
chart.render();
```